Rethinking entropy for token-level credit
Fine-grained token-level credit can give more targeted feedback for RLVR, but often requires auxiliary models, additional sampling, or privileged information [1, 2, 3].
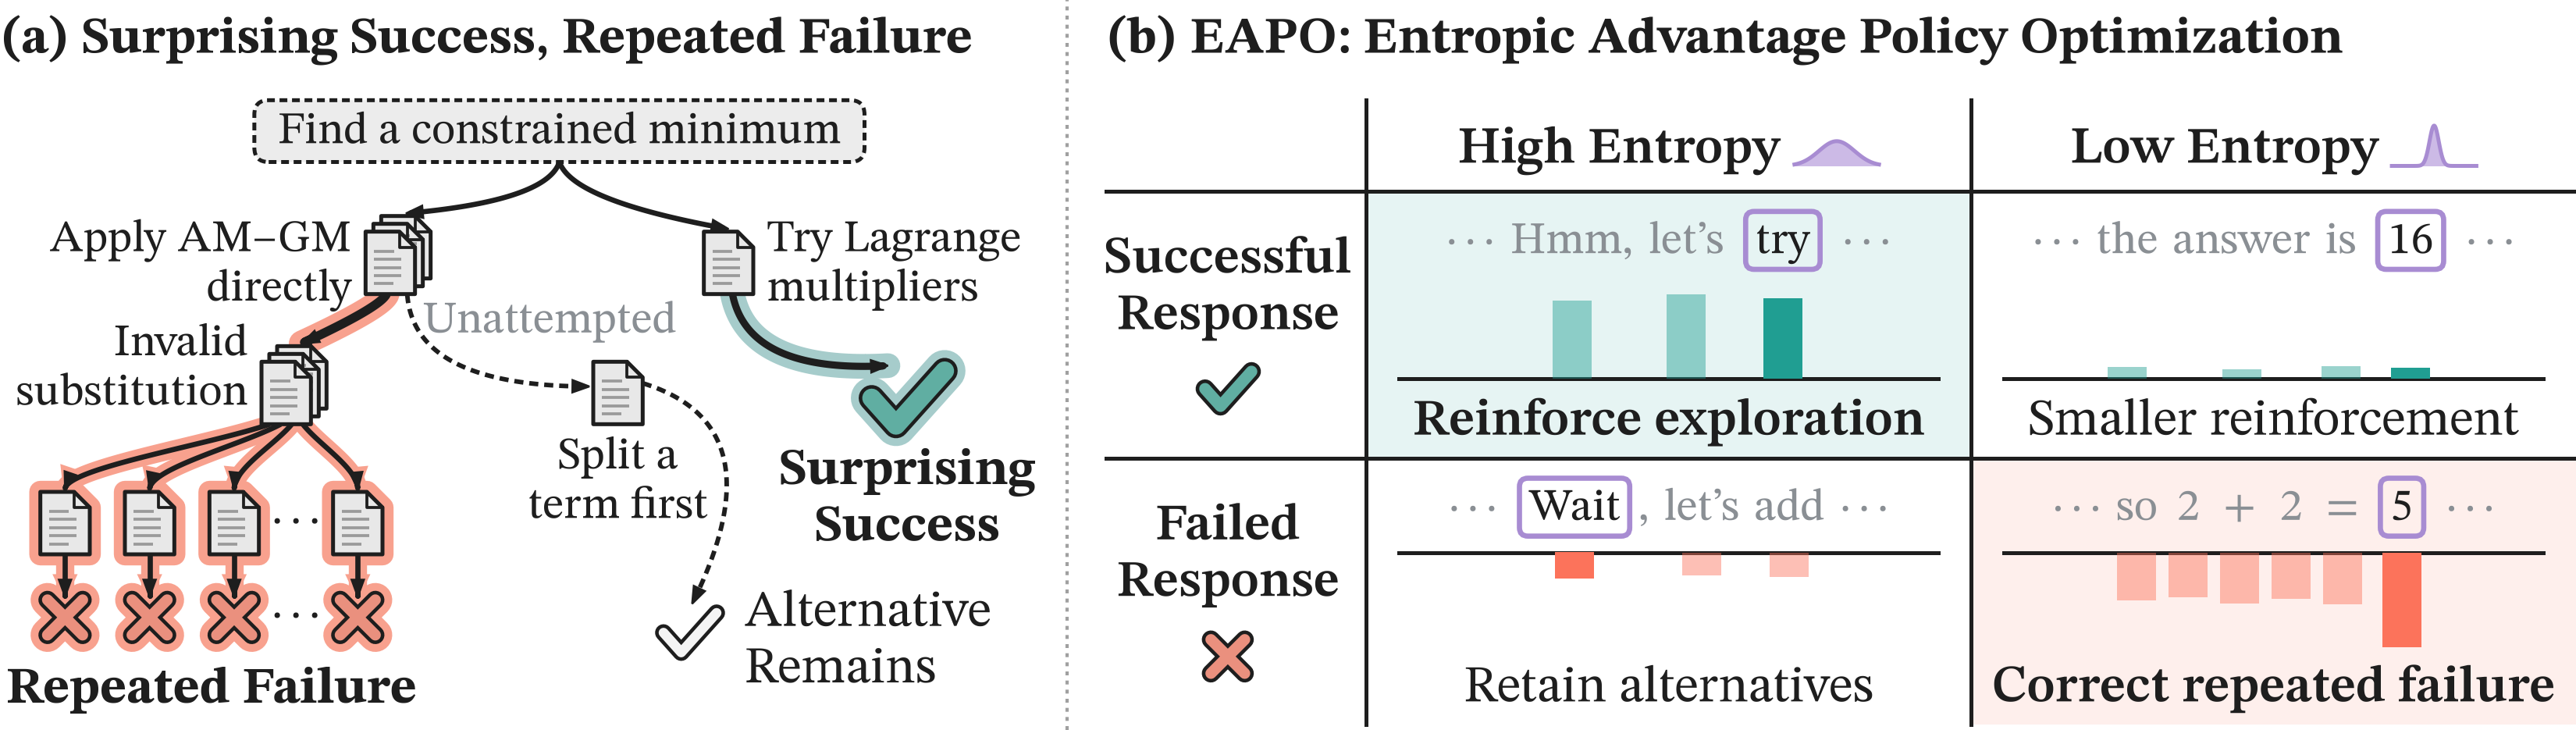
These requirements motivate the use of policy entropy, a measure of next-token uncertainty directly available from the rollout policy, as a signal for token-level feedback allocation.1Entropy of the next-token distribution, \(H_{i,t}=-\sum_{v}\pi_\theta(v\mid x,y_{i,<t})\log\pi_\theta(v\mid x,y_{i,<t})\). Unlike the surprisal of the sampled token, it describes uncertainty over all continuations. High entropy reflects competing continuations and potential branching points for exploration, whereas low entropy indicates concentrated preferences.
EntropyAdv and HAPO reshape token-level advantages [4, 5], while 80/20 selects high-entropy tokens for policy updates [6]. However, these methods treat uncertainty in the same way under success and failure, either adding nonnegative entropy bonuses regardless of outcome or favoring high-entropy positions under both positive and negative feedback. Such a shared preference places the strongest penalties on uncertain positions in failed responses, where competing continuations may still lead to recovery through alternative reasoning paths, potentially constraining further exploration.
This raises a central question: should uncertainty guide both reinforcement and penalization in the same way?
Surprising success, repeated failure
Entropy, repeatability, and recovery
To examine how entropy relates to reproducible success and recovery from failure, we select 20 moderately difficult problems for each of Qwen3-4B-Base and Qwen3-8B-Base, with two correct and two incorrect responses per problem.2Moderate difficulty means 6 to 14 correct out of 32 attempts. The first and last 20% of each response are excluded, and paired windows start within 20% of the response length of each other. We then resample 64 continuations from matched 32-token windows of high or low entropy, keeping the preceding prefix fixed.
Correct responses are harder to reproduce from high-entropy windows: accuracy falls by 18.8 and 20.7 percentage points for the 4B and 8B models. Failed responses rarely recover from low-entropy windows (7.0% and 3.2% accuracy), but recover more often from high-entropy windows (+9.3 and +12.7 points).
Entropy and word patterns
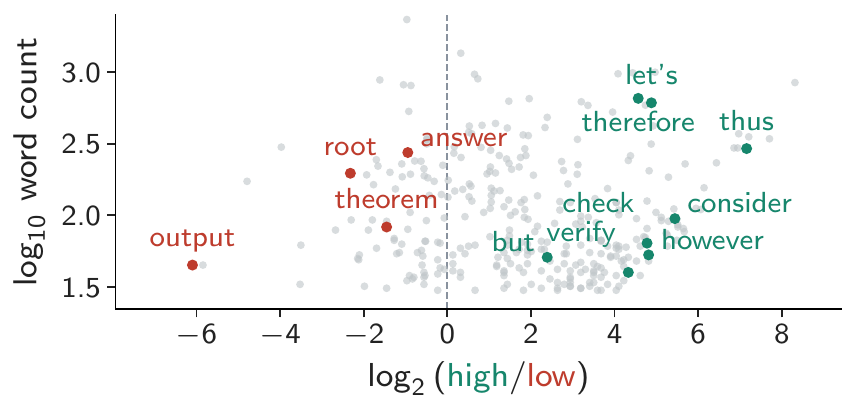
To characterize the reasoning behaviors behind these trends, we compare normalized word frequencies in the highest- and lowest-entropy 10% of tokens across 2,376 Qwen3-4B-Base responses.
(a) Correct responses
(b) Incorrect responses
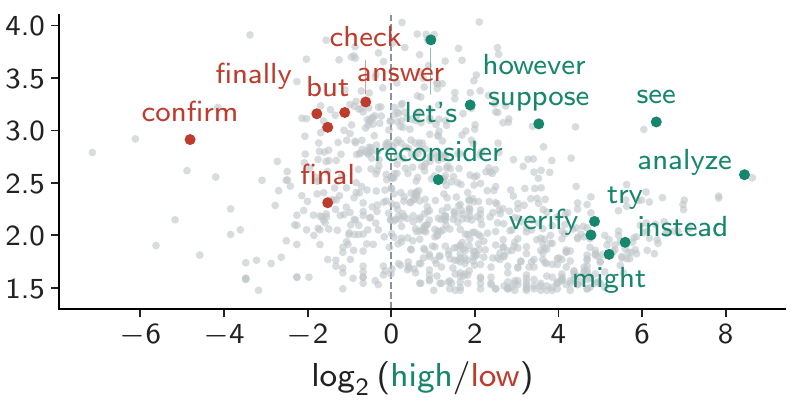
In correct responses, high-entropy positions favor exploratory expressions such as “let’s” and “consider”, consistent with successful exploration. In incorrect responses, low-entropy positions favor conclusion markers such as “finally” and “confirm”, suggesting confident failure, while high-entropy positions retain exploratory expressions such as “try” and “instead”, suggesting alternatives for recovery.
Repeated failure and a rare success
Let \(x\), \(y\), and \(z\) be positive real numbers such that \(xyz=2\). Find the minimum value of \(x^4+4y^2+4z^4\).
Repeated failure 0/28 correct
Two more failed samples
Surprising success 1/4 correct
Together, these observations suggest that successful exploration is not yet a stable preference, while confident failures tend to recur. This motivates reinforcing surprising success to make it more repeatable and correcting repeated failure while preserving uncertain alternatives for recovery.
Entropic Advantage Policy Optimization
Entropic Advantage Policy Optimization (EAPO) redistributes the response advantage \(\hat A^i\) across tokens using normalized policy entropy to reinforce surprising success and correct repeated failure while preserving uncertain alternatives for recovery.
Policy Entropy Normalization
Since policy entropy can vary substantially across responses and fluctuate sharply within a response, we normalize it to \([0,1]\) using percentiles from the rollout batch \(\mathcal B\):
\[ h_{i,t}=\operatorname{stopgrad}\!\left[\operatorname{clip}\!\left(\frac{H_{i,t}-Q_{\mathrm{lo}}}{Q_{\mathrm{hi}}-Q_{\mathrm{lo}}+\varepsilon_H},\,0,\,1\right)\right],\qquad t\in\mathcal I_i. \]\(H_{i,t}\) comes from the old policy. \(Q_{\mathrm{lo}}\) and \(Q_{\mathrm{hi}}\) are the 10th and 90th percentiles over valid completion tokens.
Asymmetric Advantage Redistribution
We couple policy entropy with the advantage sign to reverse the entropy preference between reinforcement and penalization. For \(\kappa\ge 0\), we compute token weights using signed entropy \(\operatorname{sign}(\hat A^i)h_{i,t}\) and normalize them within each response:
\[ w_{i,t}=\frac{\exp\!\big(\kappa\,\htmlClass{sgn}{\operatorname{sign}(\hat A^i)\,h_{i,t}}\big)}{\frac{1}{T_i}\sum_{u\in\mathcal I_i}\exp\!\big(\kappa\,\htmlClass{sgn}{\operatorname{sign}(\hat A^i)\,h_{i,u}}\big)},\qquad \hat A^{i,\mathrm E}_t=\hat A^i\,w_{i,t}. \]Positive advantages give more credit to high-entropy tokens, while negative advantages place larger penalties on low-entropy tokens and smaller penalties on uncertain ones. The weights are positive and average 1 within each response, preserving the sign and total advantage. The default \(\kappa=\log 4\) limits the largest-to-smallest weight ratio to 4.
We can simply replace the response advantage \(\hat A^i\) with the token-level advantage \(\hat A^{i,\mathrm E}_t\) in the policy objective. The rest of training is unchanged, with no auxiliary model or substantial additional compute.
Playground
Drag the entropy bars to see how credit shifts.
Swipe to see all tokens.
Main results
We evaluate EAPO across base and reasoning backbones on diverse reasoning benchmarks.
EAPO has the highest mean avg@32 and pass@32 on all four backbones. On the 4B and 8B base models, mean accuracy reaches 31.0% and 34.0%, exceeding the strongest entropy-based baselines by 5.6 and 4.3 points. It also exceeds RLRT on both metrics without privileged information.
Generalization to out-of-distribution tasks
On eight Reasoning Gym tasks, EAPO reaches 34.89% and 43.02% macro avg@16 for the 4B and 8B base models, 1.46 and 3.02 points above the best baselines.
Training dynamics
Training reward · Qwen3-4B-Base
Response length · Qwen3-4B, tokens
Average entropy · Qwen3-4B, nats
EAPO maintains higher training reward than the baselines over most of training, with the gap most pronounced near the end. Like other entropy-based methods, it sustains longer reasoning trajectories than GRPO.3Extending baseline responses to comparable mean lengths does not close the accuracy gap to EAPO. See Appendix C.3 of the paper. It retains higher entropy than GRPO during later training but ends below EntropyAdv and HAPO. Its stronger reasoning performance with lower final entropy suggests that higher average entropy is not a prerequisite for effective exploration.
Exploration
To examine how EAPO shapes exploration, we measure problem coverage, reasoning diversity, and the frequency of exploratory tokens.
EAPO has the highest pass@\(k\) at every tested budget on AIME26. At 256 samples, it solves one problem that no baseline solves.
Reasoning diversity
We use answer diversity as a proxy for reasoning diversity. We sample 32 responses per problem, restricting this analysis to problems with initial-model accuracy at most 25%. We measure normalized answer entropy \(H_{\mathrm{norm}}\) and collision rate \(C=\frac{\sum_i n_i(n_i-1)}{N(N-1)}\), the fraction of response pairs with the same answer, where \(n_i\) counts responses with answer \(i\) and \(N=32\).
EAPO produces more diverse final answers: \(H_{\mathrm{norm}}=0.751\) versus at most 0.672 for the baselines, and collision rate 0.101 versus at least 0.159.
Epistemic markers
EAPO generates markers such as “wait” more often per 1,000 tokens on all six benchmarks. This is consistent with more exploratory reasoning, though marker frequency alone does not establish better reasoning.
Sign-entropy coupling
To test whether reinforcement and penalization benefit from different entropy preferences, we vary these preferences independently by replacing the sign term in the token-weight formula:
\[ \operatorname{sign}(\hat A^i)\;\longrightarrow\;\begin{cases}b_+, & \hat A^i>0,\\ b_-, & \hat A^i<0.\end{cases} \]Each coefficient is chosen from \(\{-1,0,+1\}\): −1 favors low entropy, 0 gives uniform credit, and +1 favors high entropy.
avg@32 / pass@32 (%)
EAPO achieves the highest avg@32 and pass@32 on both backbones, supporting the effectiveness of reinforcing high-entropy tokens and penalizing low-entropy tokens.
Citation
@article{yeo2026eapo,
  title   = {Surprising Success, Repeated Failure: Entropy-Guided Credit Assignment for Exploration in LLM Reasoning},
  author  = {Yeo, Woongyeong and Kang, Minki and Lee, Chanuk and Park, Sangwoo and Baek, Jinheon and Hwang, Sung Ju},
  journal = {arXiv preprint arXiv:2609.33781},
  year    = {2026}
}
References
- Cui et al. (2026). Process Reinforcement through Implicit Rewards. TMLR 2026.
- Kazemnejad et al. (2025). VinePPO: Refining Credit Assignment in RL Training of LLMs. ICML 2025.
- Kim et al. (2026). Rebellious Student: Reversing Teacher Signals for Reasoning Exploration with Self-Distilled RLVR. NeurIPS 2026.
- Cheng et al. (2026). Reasoning with Exploration: An Entropy Perspective. AAAI 2026.
- He et al. (2026). Where Hindsight Credit Can Reside: A Signed-Capacity View of Token Updates in RLVR. arXiv preprint arXiv:2604.11056.
- Wang et al. (2025). Beyond the 80/20 Rule: High-Entropy Minority Tokens Drive Effective Reinforcement Learning for LLM Reasoning. NeurIPS 2025.
- Shao et al. (2024). DeepSeekMath: Pushing the Limits of Mathematical Reasoning in Open Language Models. arXiv preprint arXiv:2402.03300.